Why Mapping Matters: Tracking the Repression Against Civil Society Activists in Vietnam
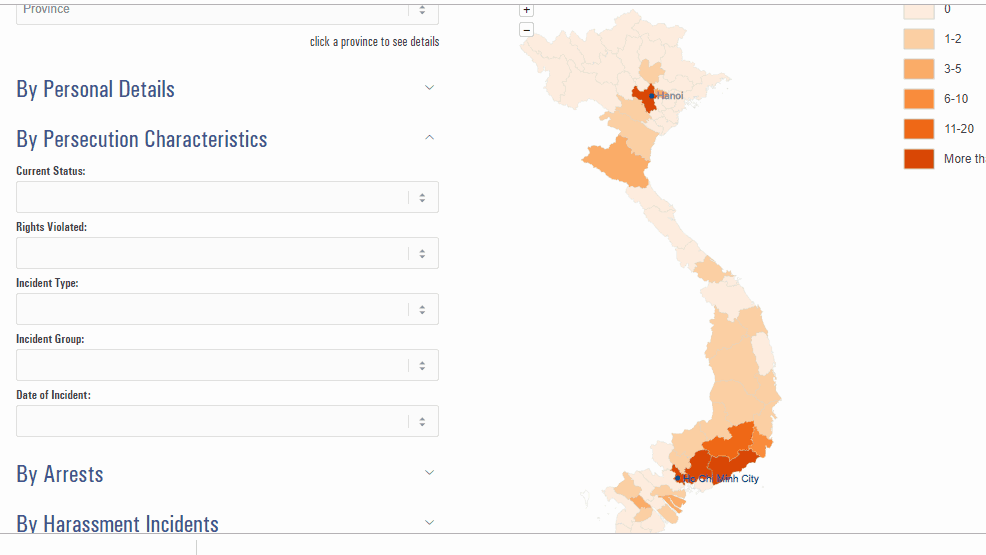
Featured photo: Province View of the Map of Human Rights Violations
It’s not often that human rights advocates, researchers, and allies gather in the same room to discuss the contexts, challenges, and motivations of their work. Most of the time, we are working in our niche fields and areas of expertise. We are—and rightly so—focused on the issues affecting our grassroots campaigns, day-to-day functioning, safety, and of course, the populations we serve. This month, The 88 Project had the honor of assembling with like-minded faculty and participants as part of the Geoffrey Nice Foundation’s Master Class on Mapping, Documenting, and Prosecuting Mass Atrocities. We were invited by the Transitional Justice Working Group (“TJWG”), a co-sponsor of the Master Class, to present on our mapping of the repression of civil society activists in Vietnam, part of our new Map of Human Rights Violations (“Map”), which we published in May 2019. TJWG’s project Access Accountability (@TJWG_AA), which facilitates training and resources for human rights documentation purposes, also hosted a weekend workshop in which we participated, focusing on strategies for implementing more geographic information system tools and other mapping techniques into practitioners’ work.
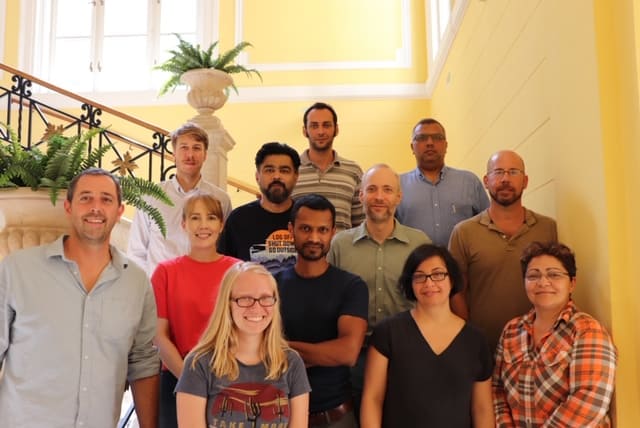
Participants of the 2019 Master Class’s technical mapping workshop sponsored by TJWG
Many people I have met in the course of my work associate Vietnam with problems of the past. While atrocities committed during the Vietnam War (and prior to it) have undoubtedly affected the current human rights situation in Vietnam, there are many issues that persist, have evolved, or have begun since the War ended. After the War, rapid industrialization, consolidation of power, and a perceived necessity for complete control led to a policy of suppression and indoctrination, including re-education camps and violence against and imprisonment of activists that continues to this day.
In present-day Vietnam, the Communist regime has complete power over institutions, media, religion, and civil society. Dissidents are targeted for a variety of reasons—some are pro-democracy organizers, others are peacefully campaigners for a clean environment or minority rights, and others yet simply desire to be able to share their opinions online without fear of arrest. Vietnam may not summarily execute dissenters, but they target them with intensive, varied, often prolonged, and increasingly less traceable forms of repression, including restrictions on movement, destruction of property and forced evictions, harassment of family, physical attacks, and surveillance. We currently are tracking a list of 23 types of incidents perpetrated against activists. All of this comes in addition to more traditional forms of repression such as arrest and inhumane treatment in detention—as well as denial of healthcare and family communications for political prisoners on widespread basis.
Behind the Database and Map

Kaylee Uland presenting on The 88 Project’s Map of Human Rights Violations at the Master Class
At the time of this writing, Vietnam has 266 known activists in prison. We’ve also identified 103 activists at risk there. There are many more people whose stories have not reached the outside world, and others yet whose information we are still verifying and processing. The backgrounds, activism efforts, current status, health information, and more for these known individuals are detailed in a comprehensive profile for each person in our Database of Persecuted Activists in Vietnam (“Database”). For each arrest of or incident against an individual, we also collect information about where the event happened. This information is used to create inputs for the Map. The Map is thus a continuation of our Database, the first searchable, English database of political prisoners—and now also activists at risk—in Vietnam.
After creating the Database and launching it in January 2018, we wanted to utilize our data on political prisoners and activists at risk in other ways in order to be able to engage with a larger audience of users. We recognize that not everyone processes information the same way, so we created the Map with the aim of not only informing advocacy efforts, but also providing an interactive, geographic way to access the data.
Our Map is a thematic map that tracks patterns of incidents for advocacy purposes and aims to hold authorities accountable at the correct level of government. We created it to analyze data regarding our suspicions of who is really carrying out the repression of dissidents (i.e. who are the perpetrators), as well as how (i.e. which types of incidents are perpetrated against them). While the Database is profile-centric, the Map is thus incident and perpetrator-centric. The tracking of both incidents and perpetrators is reflected in our decision to make two views of the Map, Province View and Incident View, which are explained below.
We also wanted to track data on the geographic distribution of the crackdown on dissent and to follow repression tactics now in order to measure progress, or lack thereof, from the Vietnamese authorities in improving conditions for human rights defenders. While we strive to pinpoint events with the most exact coordinates possible, some information is more generalized when exact coordinates are not available (for example, the name of a town versus an intersection in that town), and other information is withheld altogether if there are concerns for the activists’ security or difficulty verifying geolocation.
Using the Map
Figure 1: Province View of the Map
Once a user navigates to the Map’s home page, they will automatically be in the Province View display (Figure 1). In the Province View, users can see a gradient of incidents by province. The darker the province, the more that province has persecuted dissenters. This serves as a comparative tool to see how provinces have acted since the beginning of 2018 (when we began collecting geolocation data). Users can zoom in and out to see the provinces better or can use the filters on the left side, the same as the Database filters, to narrow down results. When hovering over a province, the name and number of incidents in that province will appear. Click on the province to see a full list of the incidents, and click on any individual incident to read more about the details and the person affected in their Database profile.
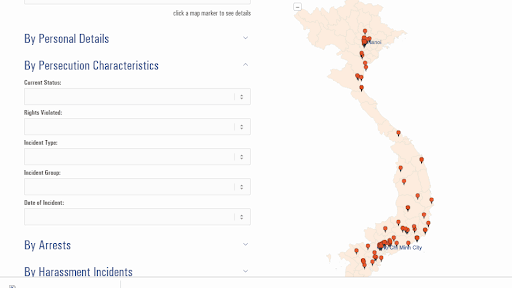
Figure 2: Incident View of the Map
Under the second Map view, the Incident View (Figure 2), push-pins appear at incident sites so that users can easily filter results by incident type and characteristics about those affected, rather than focusing on the specific province in which an incident occurred. Hover over a pushpin to see the name of the person, a brief description of the incident, and the date of the incident. Click on the pushpin to find out more information.
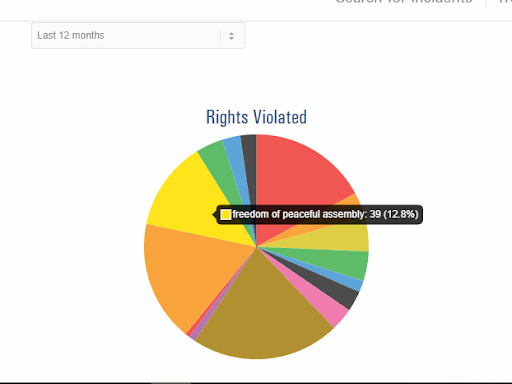
Figure 3: One of the auto-generated graphs that uses data from the Map to track trends in repression
The Map was conceptualized with user accessibility as a priority—we wanted academic researchers and regular Internet users alike to be able to explore the data. This is the reason we created filters and user-friendly details, like pop-up boxes and labels that appear when hovering over an item. With this in mind, we also decided to create the auto-generated graphs you see underneath the Map (Figure 3), which track rights violated, Criminal Code provisions used to charge activists, and provisions of the Code charged by level of authority. You can choose to see the results of these graphs for a variety of time periods, which you can select from a drop-down box in the top left corner of the “Trends and Patterns” area of the web page. Scroll over the colorful categories in the graphs to see more information, such as the explanation of the Criminal Code charge or name of the right violated in the incident.
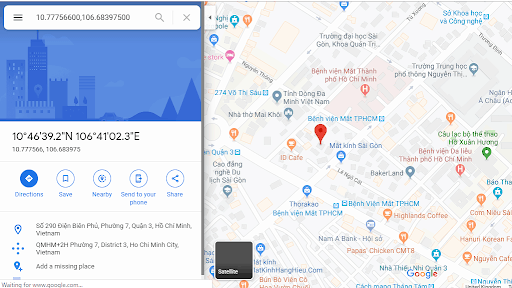
Figure 4: Google Maps sample showing location of an incident
More broadly, you can find the geolocation data we collect, which is used to make the Map, in two places. Firstly, in the Database, you can look for the “Location” field in a profile and click “Map.” We gather the location description (the name) of the location, as well as the longitude and latitude of the location. If geolocation data is available for that person, after clicking the “Map” link under the “Location” field of a profile, you will be directed to a Google Maps page pin-pointing the location of their arrest or incident (sample in Figure 4). To find the same information through the Map itself, use the filters on the Map page to find the profile you’re interested in and you will be able to see the person’s information as the filters narrow down your results.
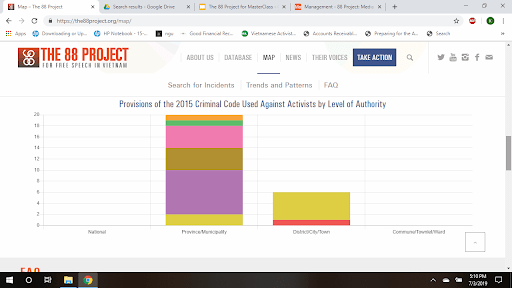
Figure 5: Sample Graph of Provisions of the 2015 Criminal Code Used Against Activists by Level of Authority
Implications
The Map tracks geolocation data starting in 2018. However, we have still been able to see some emerging trends since its launch. And with more data in the future, we believe more trends will become clear over time.
Early indicators suggest that it is provincial-level authorities, not national authorities, who are carrying out the most arrests and incidents against political prisoners and activists at risk. You can see this for yourself in the auto-generated bar graph (Figure 5), the third one at the bottom of the Map page under “Trends and Patterns.” The Map has so far confirmed our suspicions that the local administration, specifically provinces, are playing a more active role in suppressing political dissent. This may prove useful in changing advocacy efforts, which usually target the national government. One potential area of intervention would be in the area of foreign direct investment (FDI), as this is normally directed at the provincial-level authorities.
We will continue to update and improve both our data collection and verification methods, as well as the interface of the Database and Map themselves. They are in a constant state of improvement, and we welcome feedback from interested parties. We will also be looking into other potential future applications of the Map moving forward. As more trends emerge, we will update the public and interested stakeholders as to their potential implications.
This is a unique time to be researching and advocating for freedom of expression in Vietnam. Widespread protests erupted across the country in June 2018 over two draft laws, one of which– the Law on Cybersecurity—took effect in January 2019. The EU just signed a free trade agreement with Vietnam—one of the largest of its kind—which still awaits a final vote from the European Parliament. Despite uncertain trade rhetoric, Vietnam remains geo-politically important to the US, which seeks to counterbalance Chinese influence in the region. Vietnam’s own economy is booming—its GDP growth rate was nearly 7% in the third quarter of 2018. Investment continues to flow in, and tourism thrives. Few external actors are able and willing to seriously criticize the regime. Barriers to diplomatic improvement of the human rights situation remain high, so activists continue to build coalitions and network across all walks of life.
At The 88 Project, we continue to strive to provide a means by which the stories of on-the-ground activists working for peaceful change in Vietnam can be brought to a larger audience—and their ideas and hopes for Vietnam’s future incorporated into international discussions. We hope that our Database of Persecuted Activists in Vietnam and Map of Human Rights Violations can be useful to you and your work. In the face of repression of peaceful dissent anywhere, we are all partners—across disciplines, political divisions, geographic boundaries, and other artificial lines. We will keep sharing the stories of those whose voices have been silenced, and we ask you to do the same, wherever you work.
© 2019 The 88 Project


